
What are Harmonic Patterns?
Harmonic Patterns, also known as Fibonacci Patterns, are essential tools for traders seeking to predict price movements in the forex market. These patterns, formed by Fibonacci retracements and extensions, help traders identify potential reversal points and enhance their trading strategies. In this article, we’ll delve into the various types of Fibonacci Patterns, how to recognise them, and their practical applications in trading. Understanding these patterns can significantly improve your risk/reward ratio and overall trading performance.

What Are Fibonacci Patterns?
Fibonacci Patterns are chart formations based on Fibonacci retracement and extension levels that create distinct shapes. These patterns suggest that price moves in a specific direction after their formation. Each pattern is typically labeled from starting point X to completion point D, which serves as the entry signal. These points represent retracements of previous moves or extensions of retracements.

The Harmonic Gartley Pattern
The Gartley Pattern is one of the most well-known harmonic patterns. It is characterised by the following ratios:
XA: Any directional move
AB: 38.2% retracement of XA
BC: Retracement of AB between 38.2% to 88.6%
CD: Extension from BC to a range of 1.13% to 1.68%, or a 78.6% retracement from XA
This pattern indicates a complex correction where the trend remains valid, presenting an opportunity to enter at a lower price. The Gartley Pattern is valued for its excellent risk/reward ratio, with stop losses typically placed just below X and take profit levels starting at A.

The Harmonic Butterfly Pattern
The Butterfly Pattern differs from the Gartley Pattern in that it signals a reversal even when point D extends beyond point X. Key ratios include:
XA: Any directional move
AB: 78.6% retracement of XA
BC: Retracement of AB between 38.2% to 88.6%
CD: Extension from BC to a range of 1.618% to 2.24%, or a 1.27% extension of XA
This pattern typically breaks an accumulation or distribution phase in the market, signalling a strong reversal.
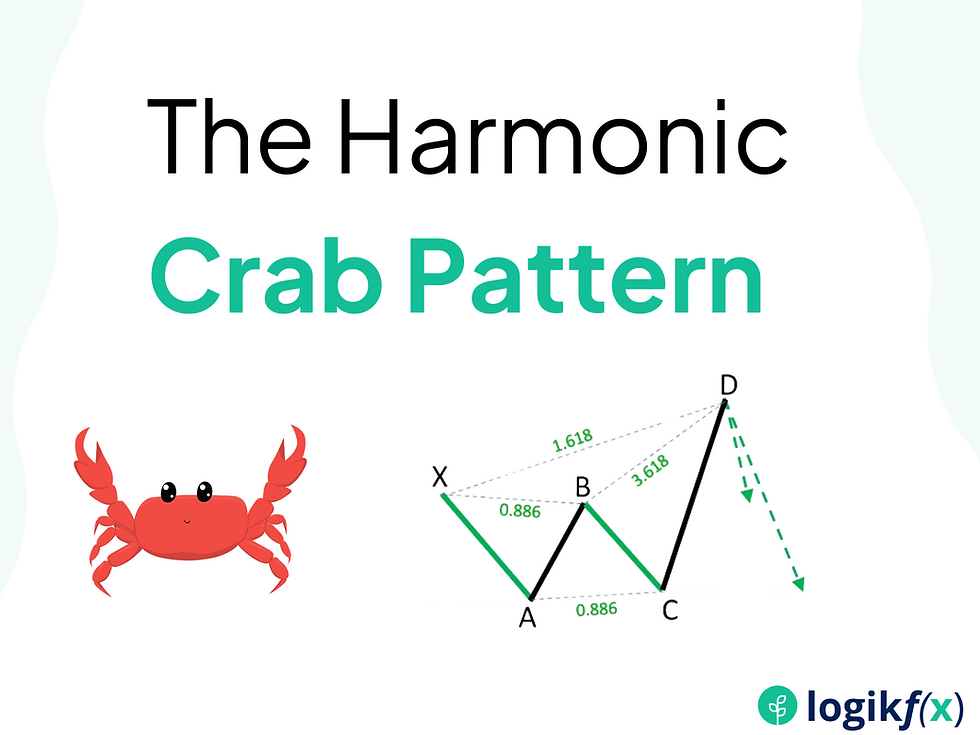
The Harmonic Crab Pattern
The Crab Pattern is known for its deep extensions and high reward potential. Its structure is as follows:
XA: Any directional move
AB: 38.2% to 61.8% retracement of XA
BC: Retracement of AB between 38.2% to 88.6%
CD: Extension from BC to a range of 2.618% to 3.618%
This pattern often results in a sharp price reversal, making it a powerful tool for traders.

The Harmonic Bat Pattern
The Bat Pattern is another popular harmonic pattern, characterised by:
XA: Any impulse or trend move
AB: 38.2% to 50% retracement of XA
BC: Retracement of AB between 38.2% to 88.6%
CD: Extension of BC to a range of 161.8% to 216.8%, or 88.6% of XA
The Bat Pattern offers high reward potential with relatively small risk.

The Harmonic Cypher Pattern
The Cypher Pattern is unique and less common, with the following structure:
XA: Any directional move
AB: 38.2% to 61.8% retracement of XA
BC: Extension of AB between 1.272% to 1.414%
CD: Extension of AB to a range of 1.272% to 200%, or a 78.6% retracement of XA
This pattern helps identify strong reversal points in the market.

The Harmonic Shark Pattern
The Shark Pattern starts with point O and completes at point C, making it unique among harmonic patterns:
OX: Any directional move
XA: Any retracement of OX
AB: Extension of AB between 1.13% to 1.618%
BC: Extension of AB to a range of 1.618% to 2.24%
This pattern is confirmed and measured from point C, indicating a potential reversal.
Why Use Harmonic Patterns?
Harmonic patterns offer a favourable risk/reward ratio, with entries invalidated if the price moves significantly beyond the Price Reversal Zone (PRZ). They also provide asymmetric upside potential, especially if they signal the start of a new trend. However, these patterns can be challenging to spot and measure manually. Fortunately, there are tools and indicators, such as Auto chartist and the XABC tool on TradingView, that can help identify these patterns automatically.
Challenges and Consensus
While harmonic patterns are highly effective, they are not magical solutions. Their success relies on consensus among traders who see and act on the same levels. This collective action creates the demand needed to drive prices. Therefore, using widely recognised patterns like Fibonacci retracements and extensions can enhance your trading strategy.

In Summary
Harmonic patterns start with an initial trend move, with subsequent moves forming the pattern. They consist of Potential Reversal Zones (PRZ), labeled as point D. These patterns offer excellent risk/reward ratios, making them attractive to traders. However, their success depends on broad recognition and consensus among market participants.
Join Logikfx Today
Ready to master Fibonacci Patterns and enhance your trading strategies? Join Logikfx today and gain access to our comprehensive suite of tools and resources. From expert insights to advanced analysis tools, Logikfx is your partner in achieving your investment goals. Sign up now and start your journey to becoming a more informed and strategic trader.

Comments